

Imagine you’ve invested in a stock, and it starts to drop. You might feel anxious, unsure whether to hold or sell. Understanding Fibonacci retracement levels can empower you to make more informed decisions when navigating market fluctuations.
By the end of this article, you’ll grasp how these levels work, allowing you to identify potential support and resistance zones in your trading strategy.
What Are Fibonacci Retracement Levels?
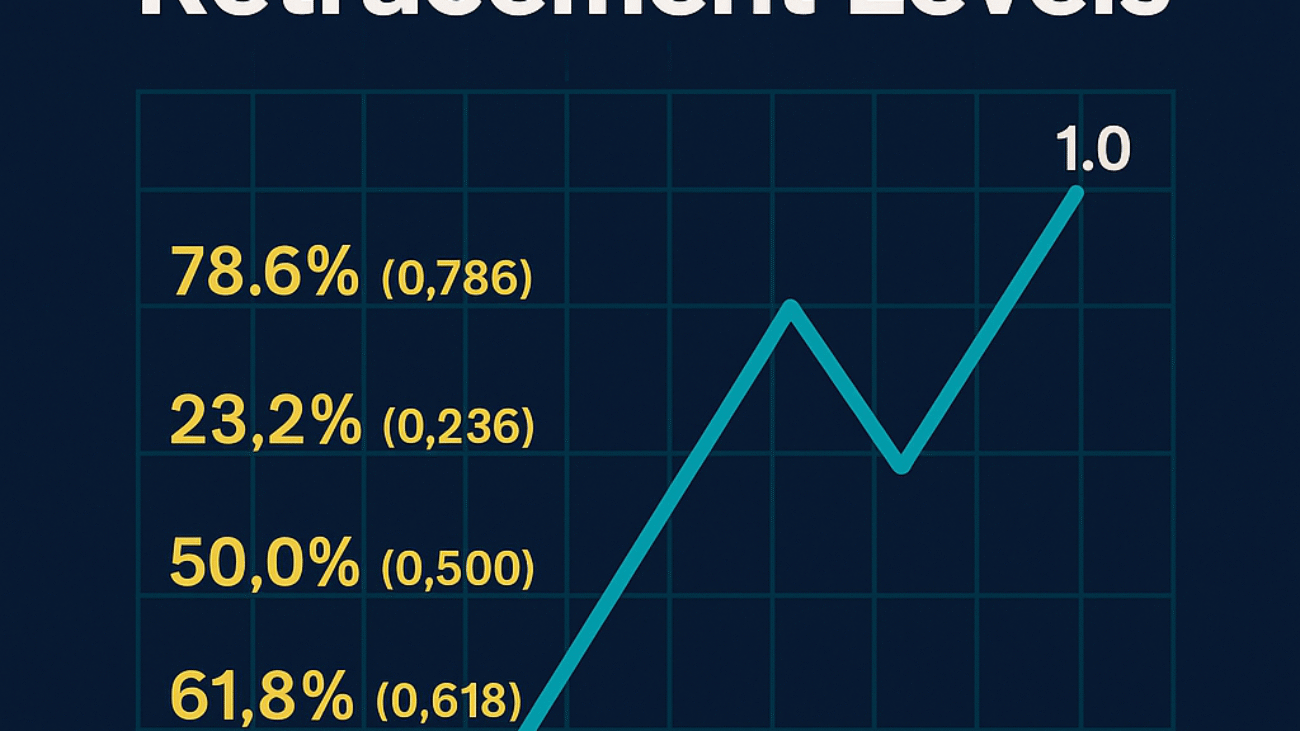
Fibonacci retracement levels are horizontal lines that indicate potential support and resistance levels based on the Fibonacci sequence. These levels help traders identify the potential reversal points after a price movement. Essentially, they help you see where prices might bounce back or reverse.
DIY tip: This week, familiarize yourself with the Fibonacci sequence. Start by drawing a simple chart and marking the key retracement levels (23.6%, 38.2%, 50%, 61.8%, and 100%) based on a recent price movement.
Why Use Fibonacci Levels in Trading?
Many traders rely on Fibonacci levels due to their psychological significance. Investors often react at these levels, leading to increased trading volume and volatility. This behavior can create opportunities to enter or exit trades effectively based on historical price actions.
DIY tip: When you identify a trending stock, use Fibonacci levels to gauge entry and exit points. Check if the stock price approaches one of the key retracement levels, which may indicate a good buying or selling opportunity.
Common Mistakes with Fibonacci Retracements
Many beginners use Fibonacci levels incorrectly, often applying them to inappropriate price movements or time frames. It’s crucial to ensure you’re drawing Fibonacci retracement levels between a significant high and low, as using irrelevant data can lead to misleading signals.
DIY tip: Always validate your Fibonacci retracement levels with additional technical analysis tools. Try combining them with other indicators, like moving averages or trend lines, to confirm your analysis.
Tips for Combining Fibonacci with Other Strategies
To enhance your trading strategy, consider integrating Fibonacci retracement levels with other technical analysis methods, like candlestick patterns or MACD (Moving Average Convergence Divergence). This blended approach can provide more clarity and confidence in your trading decisions.
DIY tip: Explore a comprehensive financial scoring tool that helps evaluate different aspects of your trading strategy. Combining Fibonacci levels with quality indicators can lead to a more robust trading plan.
A Practical Example
Meet an investor who recently noticed a stock rising sharply over a few weeks. After some time, the stock price started retracing downward. They applied Fibonacci retracement levels and noticed that the most critical retracement level was at 50%. They decided to buy more shares at this level, anticipating a rebound. A week later, the price began rising again, confirming their decision.
Case Study
Consider Anil, 28, from Mumbai, working as a marketing professional with a monthly investible surplus of ₹35,000. Initially, he invested largely in traditional fixed deposits. After learning about Fibonacci levels, he began investing in stocks.
By applying Fibonacci retracement levels, Anil identified an important buying zone in a stock he was interested in. With an investment of ₹10,000 at a 61.8% retracement, his stock price eventually rose, yielding him a profit of around ₹5,000 within two months. This example illustrates how understanding Fibonacci levels can lead to better investment decisions.
Frequently Asked Questions
What is the significance of the 61.8% retracement level?
The 61.8% level is often referred to as the “golden ratio.” It has historical significance and is commonly seen as a strong reversal point. Many traders watch this level closely, expecting price action to react here.
Can Fibonacci retracement levels guarantee price reversal?
No, Fibonacci levels do not guarantee a price reversal. They are used as tools to predict potential areas of support and resistance but should be used alongside other indicators for improved accuracy.
How do I draw Fibonacci retracement levels on a chart?
Select the Fibonacci retracement tool in your trading platform. Click on the high point and drag it down to the low point of your desired price movement. The tool will automatically generate the key levels on your chart.
How frequently should I use Fibonacci retracement levels?
You can use Fibonacci retracement levels on any time frame you prefer, from daily to hourly charts. However, the effectiveness may vary based on the time frame and market conditions. Choose levels that fit your trading style.
Conclusion
Understanding Fibonacci retracement levels provides valuable insights into market movements. You can enhance your trading strategy and increase confidence in your decisions. Ready to see how this works for you? Test your strategy with the WealthAlpha Portfolio Evaluator.
Disclaimer: This article is for educational purposes only and does not constitute investment advice. Mutual fund and securities investments are subject to market risks. Past performance does not indicate future results. Please read all scheme-related documents carefully and consult a SEBI-registered investment adviser before investing.