

Imagine you’re looking at a stock chart, trying to make sense of its movements, but everything seems overwhelming. You wish to identify the right moments to buy or sell effortlessly. After reading this article, you will understand candlestick patterns and how they can guide your trading decisions.
Candlestick patterns serve as visual indicators that help you gauge market sentiment. With a bit of practice, you can quickly learn to interpret these patterns to predict future price movements, enhancing your investing skills.
What Are Candlestick Patterns and Why They Matter
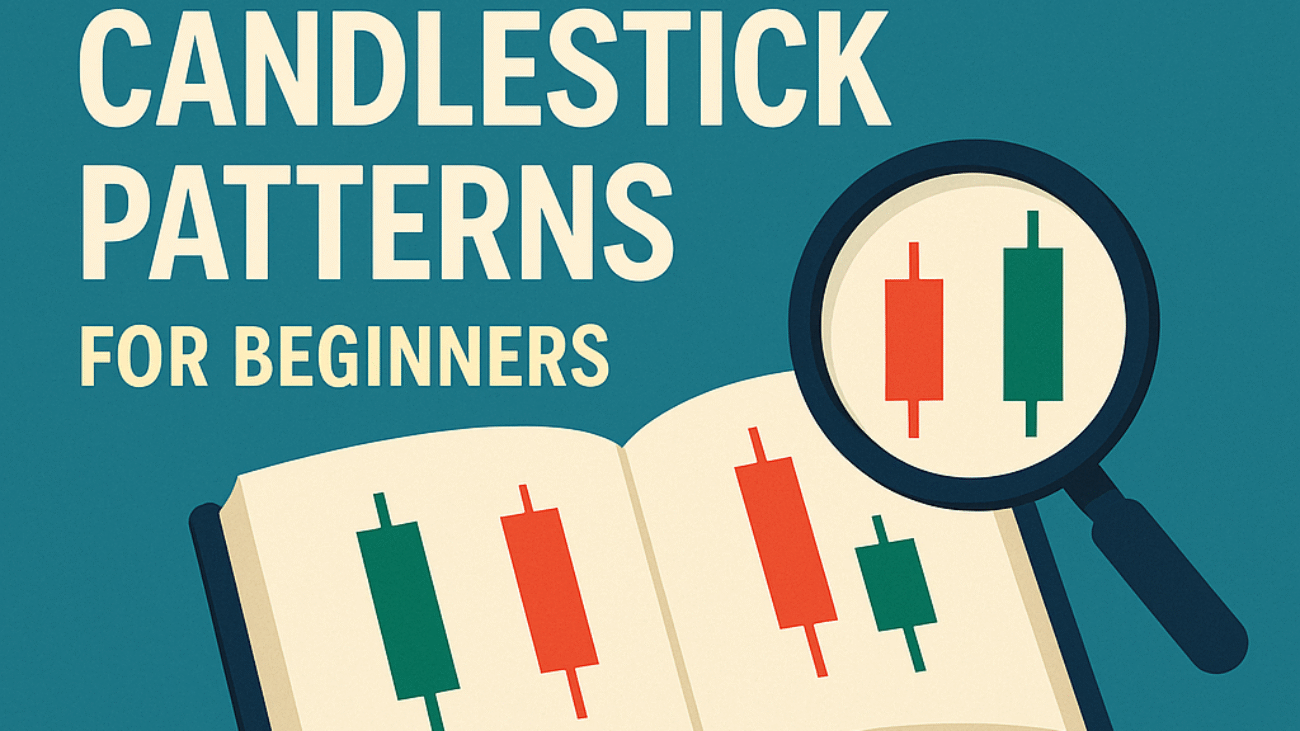
Candlestick patterns are visual representations of price movements over a specific time period. Each “candlestick” indicates the open, high, low, and close prices during that period. Recognizing these patterns helps you understand market momentum and trends.
DIY tip: Start by familiarizing yourself with basic patterns like Doji, Hammer, and Bullish Engulfing. Set aside 15 minutes daily to observe these patterns on a stock chart.
How to Read Candlestick Charts
Reading candlestick charts requires a few essential skills. Focus on the color and size of the candlesticks: a green (or white) candle signifies a price increase, while a red (or black) one indicates a decrease. The length of the wick (the thin line) shows market volatility during that period.
DIY tip: Use free online resources to practice reading candlestick charts. Set up a demo trading account and apply these readings to potential trades.
Identifying Key Patterns for Investment Decisions
Certain candlestick patterns can indicate strong buying or selling opportunities. For instance, a Bullish Engulfing pattern may suggest an impending price increase, while a Bearish Engulfing pattern might warn of a decrease. Familiarity with these patterns allows you to make informed investment decisions.
DIY tip: Create a notebook to track the outcomes of trades based on specific patterns. Note what worked and what didn’t to refine your strategy over time.
The Role of Volume in Candlestick Analysis
Volume, the number of shares traded, adds depth to candlestick patterns. High trading volume during a pattern formation can validate the pattern’s reliability. For example, a price increase confirmed by increased volume suggests strong bullish sentiment.
DIY tip: Monitor volume alongside price movements. Use a volume indicator on your trading platform to keep track of significant changes.
A Practical Example
Consider an investor who identifies a Bullish Engulfing pattern on a stock’s chart. After studying the accompanying volume, they decide to buy 100 shares at ₹500 each. Over the following week, the stock price rises to ₹550, offering a potential profit of ₹5,000.
Case Study
Meet Ravi, 28, from Bengaluru, who works as an IT consultant and has a monthly investible surplus of ₹30,000. He was initially unsure about making trades. However, after learning about candlestick patterns, he identified a Bullish Engulfing pattern on a tech stock and invested ₹10,000.
Within a week, the stock climbed, and Ravi sold for ₹12,500, realizing a profit of ₹2,500. This positive outcome encouraged him to regularly analyze candlestick patterns before investing, illustrating how even a small change can significantly impact results.
Frequently Asked Questions
What basic candlestick patterns should beginners learn?
Beginners should focus on patterns like Doji, Hammer, and Engulfing patterns, as they often indicate potential market reversals.
How does volume affect candlestick patterns?
Volume provides context to candlestick patterns. A pattern confirmed by high volume is generally more reliable, indicating stronger market sentiment.
Can I use candlestick patterns with other analysis methods?
Yes, combining candlestick analysis with technical indicators and fundamental analysis can enhance your decision-making process significantly.
Where can I practice my candlestick reading skills?
Consider using demo trading accounts available on several platforms. Many offer virtual trading environments to build your skills without financial risk.
Conclusion
Candlestick patterns offer valuable insights into market trends and investor sentiment. By learning to read these patterns, you’re better equipped to make informed investment decisions. Ready to see how this works for you? Test your strategy with the WealthAlpha Portfolio Evaluator.
Disclaimer: This article is for educational purposes only and does not constitute investment advice. Mutual fund and securities investments are subject to market risks. Past performance does not indicate future results. Please read all scheme-related documents carefully and consult a SEBI-registered investment adviser before investing.