

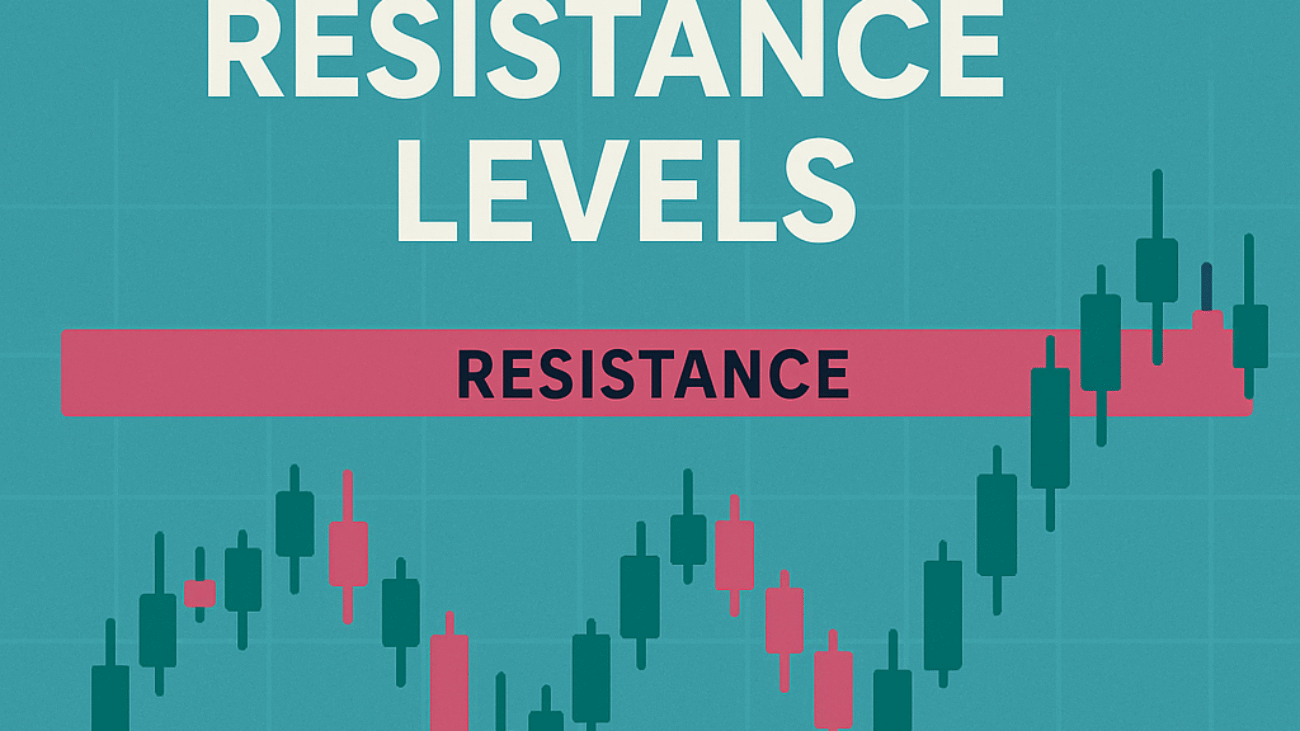
Have you ever been unsure about when to buy or sell a stock? Perhaps you’ve watched prices fluctuate and wished for guidance. Understanding support and resistance levels can help you make more informed trading decisions. After reading this article, you’ll be able to identify these crucial levels in stock charts.
Support levels indicate where a price tends to stop falling and bounce back up, while resistance levels show where prices struggle to rise further. These concepts not only help you gauge price trends but also manage your risks effectively.
What Are Support and Resistance Levels?
Support levels act like a safety net for prices. When a stock reaches this level, buying interest usually increases, preventing further decline. Conversely, resistance levels create a ceiling. At this stage, selling pressure is typically stronger, causing prices to drop.
DIY tip: Start keeping an eye on your favorite stocks. Use a basic charting tool to identify recent highs and lows. Mark these points, as they often indicate future support and resistance levels.
How to Identify Support and Resistance Levels
Identifying these levels requires observing price movements over time. Look for areas where prices frequently reverse direction. This could be a level where a stock has bounced off multiple times or where it has repeatedly failed to break through. You can also use moving averages to help indicate these zones.
DIY tip: For your next trade, observe a stock’s price action for several days or weeks. Note where it consistently bounces or falls back to. Keeping a record can help refine your insights.
Utilizing Support and Resistance in Your Trading
Once you’ve identified support and resistance levels, use them to set potential entry and exit points. If a stock approaches support, it might be a good buying opportunity. Conversely, if it nears resistance, that might be a sign to sell or take profits.
DIY tip: Create a simple trading plan using your identified levels. For instance, you might decide to buy if a stock hits support with strong buying volume. This adds structure to your decision-making process.
Using Indicators to Strengthen Your Analysis
Many traders use indicators like the Relative Strength Index (RSI) or Bollinger Bands to complement their analysis of support and resistance. These tools provide additional context about market conditions and can enhance your understanding of price movements.
DIY tip: Explore these indicators using free online resources. Adjusting your approach based on indicator signals, when combined with support and resistance levels, can lead to more strategic trading decisions.
A Practical Example
Consider an individual investor who notices a stock consistently bouncing at ₹500. After several observations, they recognize this as a strong support level. On the other hand, the same stock struggles to surpass ₹600. After monitoring these levels, the investor buys at ₹505 and sells at ₹595, realizing a profit.
Case Study: Neha’s Journey in Mumbai
Meet Neha, 28, from Mumbai. Working as a marketing executive, she has a monthly investible surplus of ₹30,000. Initially, she didn’t utilize support and resistance in her trading. After learning, she noticed that a popular stock hovered around a ₹300 support and a ₹350 resistance. By purchasing at ₹305 and selling near ₹340, she increased her monthly gains significantly. This illustrative case demonstrates the potential benefit of applying these concepts.
Frequently Asked Questions
What is the significance of support and resistance levels?
Support and resistance levels help traders make informed decisions by indicating potential price reversals and trends. They signify where buyers and sellers are likely to act.
How can I use these levels in my trading strategy?
Incorporate support and resistance in your trading plan by setting entry and exit points based on these levels. Consider buying near support and selling near resistance.
Do these levels remain constant over time?
Support and resistance levels can change based on market conditions and price movements. It’s essential to regularly reassess these levels as part of your strategy.
Can indicators improve my analysis of these levels?
Yes, using indicators like RSI or moving averages can provide context. They can enhance your insights when combined with support and resistance levels, improving your trading decisions.
Conclusion
Understanding support and resistance levels is crucial for effective trading. They serve as valuable tools to help you make informed decisions and manage risks.
Ready to see how this works for you? Test your strategy with the WealthAlpha Portfolio Evaluator.
Disclaimer: This article is for educational purposes only and does not constitute investment advice. Mutual fund and securities investments are subject to market risks. Past performance does not indicate future results. Please read all scheme-related documents carefully and consult a SEBI-registered investment adviser before investing.