

Imagine you’re at the edge of a trading decision, unsure if it’s a good time to buy or sell. You wish you had a simple tool that could help confirm your gut feeling. After reading this article, you’ll know how to effectively use the Stochastic Oscillator for trading decisions.
This powerful momentum indicator can help you identify overbought or oversold conditions in the market. By the end, you’ll have actionable insights to integrate the Stochastic Oscillator into your trading strategy, giving you the confidence to make informed trading decisions.
Understanding the Stochastic Oscillator
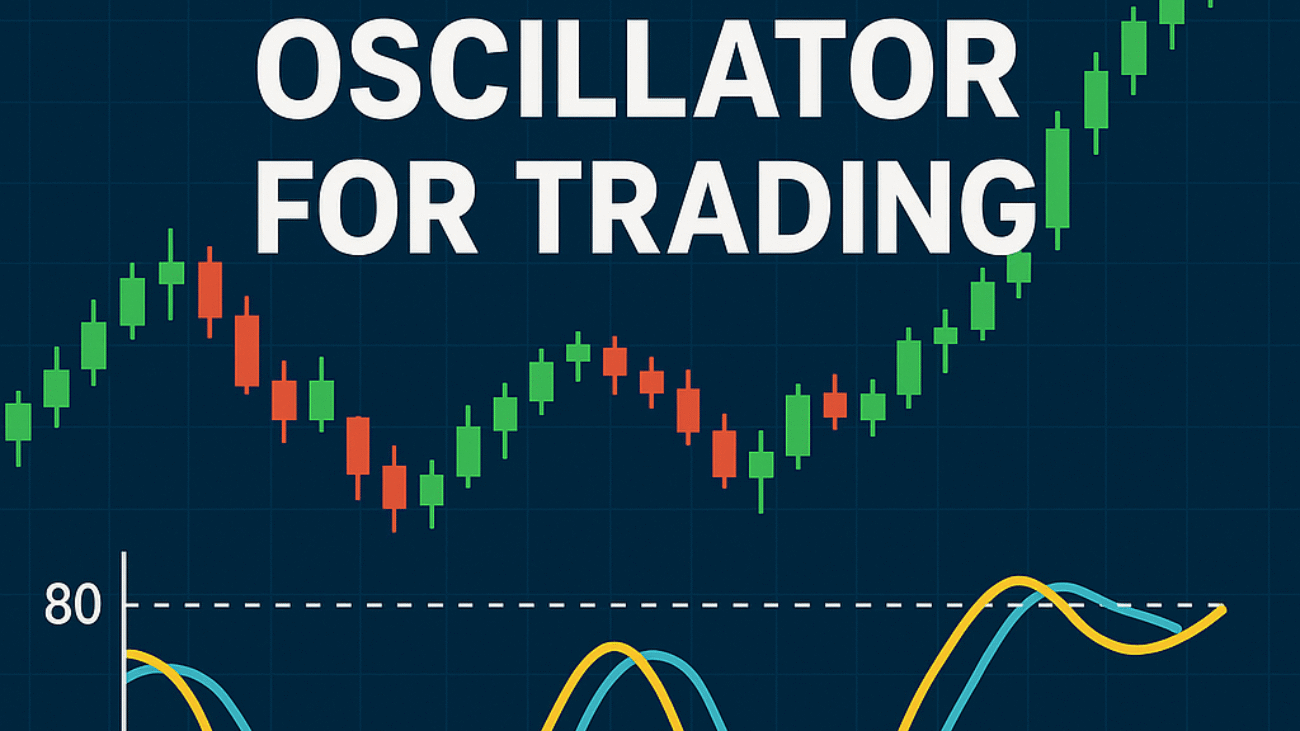
The Stochastic Oscillator is a momentum indicator that compares a security’s closing price to its price range over a specific period. It helps you determine whether an asset is overbought (potentially overpriced) or oversold (potentially undervalued). Usually displayed on a scale of 0 to 100, readings above 80 indicate overbought conditions, while readings below 20 indicate oversold conditions.
DIY tip: Check the Stochastic Oscillator for your preferred stocks and ETFs (Exchange-Traded Funds) this week. Note any overbought or oversold signals to help guide your trades.
How to Interpret Stochastic Oscillator Signals
There are two key lines in the Stochastic Oscillator: the %K and %D lines. The %K line is the main line and is more sensitive to price movements, while the %D line acts as a signal line that smooths out the %K line’s fluctuations. Traders often look for crossovers between these two lines to trigger buy or sell signals. A buy signal occurs when the %K line crosses above the %D line, while a sell signal occurs when the opposite happens.
DIY tip: This week, watch for crossovers on your Stochastic Oscillator chart for stocks you own or are considering. Document whether these signals align with your trading strategies.
Effective Risk Management with Stochastic Oscillator
Using the Stochastic Oscillator alone can sometimes lead to false signals. That’s why it’s important to combine it with other indicators for effective risk management. For example, consider a moving average to see the general trend of the asset price. If the Stochastic Oscillator suggests a buy signal while the moving average indicates a downtrend, you might want to exercise caution.
DIY tip: Start tracking one additional indicator alongside the Stochastic Oscillator this week. Choosing a simple moving average can provide you with a clearer market direction and enhance your risk management strategy.
Spotting Divergence in the Stochastic Oscillator
Divergence occurs when the price of an asset is moving in the opposite direction of the Stochastic Oscillator. Bullish divergence happens when prices make lower lows but the oscillator shows higher lows, signaling a potential upward reversal. Conversely, bearish divergence occurs when prices make higher highs while the oscillator shows lower highs, suggesting a possible downward reversal. Identifying divergence can offer valuable trading opportunities.
DIY tip: Keep an eye on potential divergences in the weekly charts you analyze. Look for at least one instance this week where price movement does not align with the Stochastic Oscillator signals.
A Practical Example
Consider an anonymous investor who consistently used the Stochastic Oscillator to trade. After noticing a strong bullish signal from the indicator, they decided to buy shares in a trending stock. A month later, the stock price surged, resulting in a profitable outcome for the investor, reinforcing the effectiveness of their approach.
Case Study
Meet Raj, a 32-year-old marketing executive from Bangalore with a monthly investible surplus of ₹30,000. Initially, he struggled to find reliable entry and exit points in the volatile market. After learning about the Stochastic Oscillator, Raj started using it to analyze his favorite stocks. He identified overbought and oversold signals and began timing his trades accordingly. Within three months, he reported an illustrative increase of ₹45,000 in his portfolio, showcasing the impact of this trading tool.
Frequently Asked Questions
What is the best period to set for the Stochastic Oscillator?
A common setting is 14 periods, but traders often adjust this based on their trading style and the asset being analyzed. Shorter periods can create more signals, but may also lead to false ones.
Can the Stochastic Oscillator be used for all asset types?
Yes, it can be applied to various assets, including stocks, commodities, and forex. Just ensure to consider the specific nuances of each asset class.
What are the limitations of the Stochastic Oscillator?
It can generate false signals, especially in trending markets. Therefore, it’s best used in conjunction with other indicators to provide context and confirmation.
How often should I check the Stochastic Oscillator?
While daily checks can help, many traders prefer a weekly review to smooth out daily fluctuations. This allows for a more strategic long-term approach to trading.
Conclusion
The Stochastic Oscillator is a valuable tool for making informed trading decisions, helping you identify market conditions and potential reversals. By combining it with other strategies and analysis, you can enhance your trading effectiveness.
Ready to see how this works for you? Test your strategy with the WealthAlpha Portfolio Evaluator.
Disclaimer: This article is for educational purposes only and does not constitute investment advice. Mutual fund and securities investments are subject to market risks. Past performance does not indicate future results. Please read all scheme-related documents carefully and consult a SEBI-registered investment adviser before investing.