

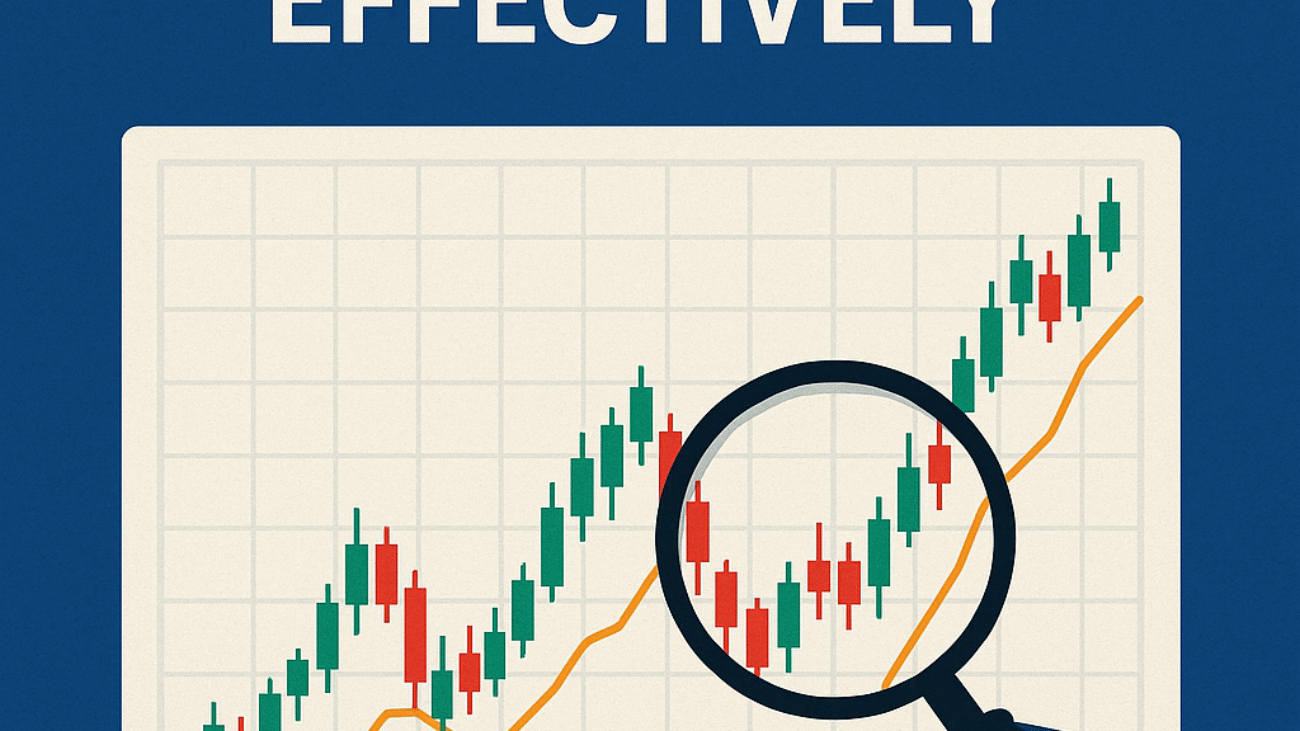
Imagine you’re contemplating an investment but feel lost in a sea of numbers and graphs. You want to make timely decisions, but the charts seem daunting. After reading this article, you’ll be able to interpret stock charts effectively and gain insights that can shape your investment journey.
By mastering chart reading, you won’t just analyze price movements; you’ll understand the market’s emotions and trends. Let’s break down the essentials of reading stock charts effectively.
Understanding Stock Charts: What They Represent
Stock charts visually represent the price movements of a stock over time. They include important information like open, high, low, and closing prices. The most common types of charts are line charts, bar charts, and candlestick charts. Each serves a different purpose, making it easier for you to spot trends.
DIY tip: Start by familiarizing yourself with different types of charts. Use online resources or apps to practice reading them. Investing a few minutes daily can turn chart reading into a simple routine.
Identifying Trends: Bullish and Bearish Markets
Trends are the direction that stock prices move over time. A bullish trend indicates rising prices, while a bearish trend shows declining prices. Recognizing these trends helps in deciding when to enter or exit a trade. Look for patterns in historical data; they often repeat.
DIY tip: Mark key trendlines on your charts. Draw lines connecting the price lows during uptrends and the highs during downtrends. This offers a clear visual of the stock’s momentum.
Volume Analysis: Understanding Market Activity
Volume indicates how many shares are traded during a specific timeframe. High volume during price increases often signals strong interest, while low volume suggests weak interest. Monitoring volume can provide insight into whether a trend will continue or reverse.
DIY tip: Incorporate volume into your analysis. Keep an eye on the volume bars below the price chart. A spike in volume can confirm a breakout or a reversal.
Using Indicators: Tools for Better Predictions
Technical indicators, like moving averages and the Relative Strength Index (RSI), can help you make more informed decisions. Moving averages smooth out price data, making trends easier to see. The RSI measures whether a stock is overbought or oversold, offering clues on potential price corrections.
DIY tip: Experiment with a few indicators on your preferred trading platform. Configure them on your charts and pay attention to how they align with price movements.
A Practical Example
Consider an investor who, using stock charts, notices a bullish trend on a specific stock. After recognizing increasing volume and a strong breakout from a moving average, they decide to invest. A few weeks later, the stock climbs significantly, validating their analysis.
Case Study: Rajesh’s Journey with Stock Charts
Meet Rajesh, 35, from Mumbai, a marketing executive with a monthly investible surplus of ₹30,000. Initially, he invested blindly, often losing money due to lack of understanding. After attending a workshop, he learned how to read stock charts effectively.
Rajesh observed stocks with consistent price patterns and identified a bullish trend on one. He invested ₹15,000 into that stock. A month later, thanks to his newfound skills, Rajesh sold it for a ₹5,000 profit. (Illustrative figures, not a forecast.)
Frequently Asked Questions
What are the basic components of stock charts?
Stock charts typically display price points such as the open, high, low, and close. Some include volume data, trends, and technical indicators to help in analysis.
How do I know which chart type to use?
Choose a chart type based on your investment strategy. Line charts are great for overview trends, while candlestick charts offer detailed daily price movements, allowing for better analysis.
Can I rely solely on indicators for trading decisions?
While indicators are valuable tools, they should not be the sole factor in your trading decisions. Combine them with price action and volume analysis for a comprehensive view.
How often should I check stock charts?
This depends on your trading style. Day traders may check charts several times a day, while long-term investors might look weekly or monthly to formulate their strategy.
Conclusion
Reading stock charts effectively can transform your investing experience. By understanding trends, volume, and indicators, you’ll make more informed decisions. Ready to see how this works for you? Test your strategy with the WealthAlpha Portfolio Evaluator.
Disclaimer: This article is for educational purposes only and does not constitute investment advice. Mutual fund and securities investments are subject to market risks. Past performance does not indicate future results. Please read all scheme-related documents carefully and consult a SEBI-registered investment adviser before investing.