

Many investors face confusion when trying to predict market movements. You may have seen shares fluctuate without any clear reason. Understanding chart patterns like the “Head and Shoulders” can empower you to make informed decisions and enhance your investment strategy.
By mastering this pattern, you’ll be able to identify potential reversals in stock trends, enabling you to make smarter buy or sell decisions. Stick with me as we break down this valuable tool for your investing toolbox!
Understanding the Head and Shoulders Pattern
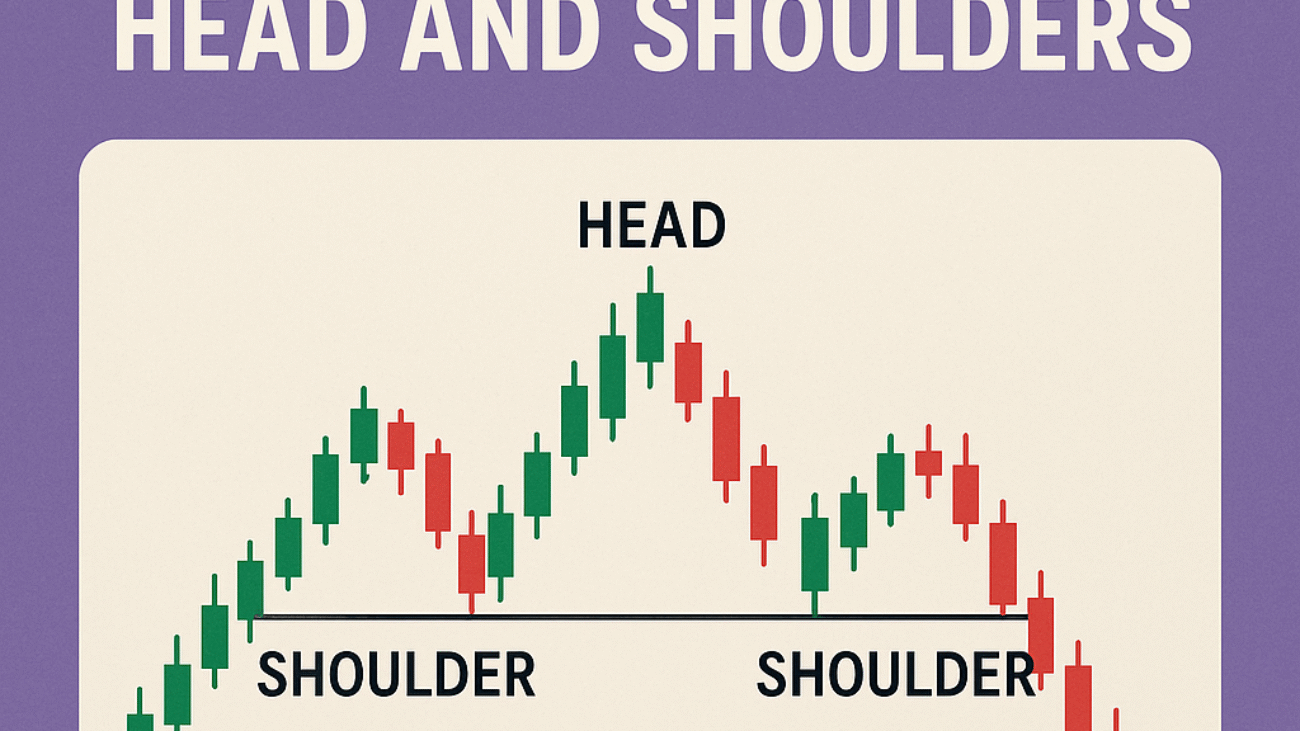
The Head and Shoulders pattern is recognized as one of the most reliable trend reversal patterns. It consists of three peaks: the left shoulder, the head, and the right shoulder. When the pattern forms, it indicates a potential change in the direction of the market.
DIY tip: To practice identifying this pattern, take a few minutes to review charts of your favorite stocks. Look for three peaks in the arrangement mentioned above. This simple exercise will sharpen your skills!
Identifying the Trend Reversal
Investors often observe that the Head and Shoulders pattern can signal a transition from bullish (upward) to bearish (downward) trends. This gives traders a chance to protect their gains. Recognizing early signs of this pattern can prepare you to make timely investment decisions.
DIY tip: Set up alerts on your trading platform for stocks that exhibit early signs of the Head and Shoulders pattern. Immediate notifications can help you react quickly!
Trading the Head and Shoulders Pattern
Once you confirm this pattern, it’s crucial to define your entry and exit points. Investors usually enter a trade after the price breaks below the neckline formed by the two shoulders. This strategy can lead to more informed trading decisions and potentially higher profits.
DIY tip: Consider using a paper trading account to simulate trades based on the Head and Shoulders pattern. This hands-on experience will build your confidence before trading with real money.
Limitations of the Head and Shoulders Pattern
While the Head and Shoulders chart pattern is powerful, it’s not infallible. False signals can occur, leading to unsuccessful trades. It’s essential to combine this technique with other analysis methods for a balanced approach.
DIY tip: Use technical indicators like the RSI (Relative Strength Index) to confirm signals from the Head and Shoulders pattern. This additional layer of analysis can enhance your trading effectiveness.
A Practical Example
Let’s consider an investor named Arun, who recently spotted a Head and Shoulders pattern in a popular tech stock. He decided to sell when the stock broke below the neckline, anticipating a downward trend. A month later, his prediction held true, allowing him to maximize profits by exiting the trade early.
Case Study
Meet Priya, a 28-year-old marketing professional from Bengaluru. Each month, she invests ₹30,000 in the stock market. After learning about the Head and Shoulders pattern, she identified a stock forming this pattern and exited a position she initially thought was safe. By acting promptly, Priya managed to save ₹4,000 that would have otherwise been lost in a downtrend. This decision transformed her cautious approach into a more proactive investment strategy. (Note: This is an illustrative example, not a forecast.)
Frequently Asked Questions
What is the significance of the Head and Shoulders pattern?
This pattern indicates a potential reversal in the market trend, often signaling that a bullish trend may transition into a bearish one. Recognizing it can help investors act before significant downturns.
How can I spot a Head and Shoulders pattern?
Look for three peaks where the middle peak (the head) is higher than the two outer peaks (the shoulders) and two troughs connecting them. The neckline connects the lows of the two shoulders.
What does it mean when a Head and Shoulders pattern fails?
A failed Head and Shoulders pattern occurs when the expected downward movement does not materialize. This emphasizes the importance of using additional analysis tools to confirm signals.
Can I use this pattern in any market?
The Head and Shoulders pattern can be applied across various markets, including equities, commodities, and forex. Its principles remain consistent, making it a versatile tool for traders.
Conclusion
The Head and Shoulders pattern is a valuable tool for any investor aiming to improve their strategy. By identifying trend reversals, you can enhance your trading outcomes. Ready to see how this works for you? Test your strategy with the WealthAlpha Portfolio Evaluator.
Disclaimer: This article is for educational purposes only and does not constitute investment advice. Mutual fund and securities investments are subject to market risks. Past performance does not indicate future results. Please read all scheme-related documents carefully and consult a SEBI-registered investment adviser before investing.