

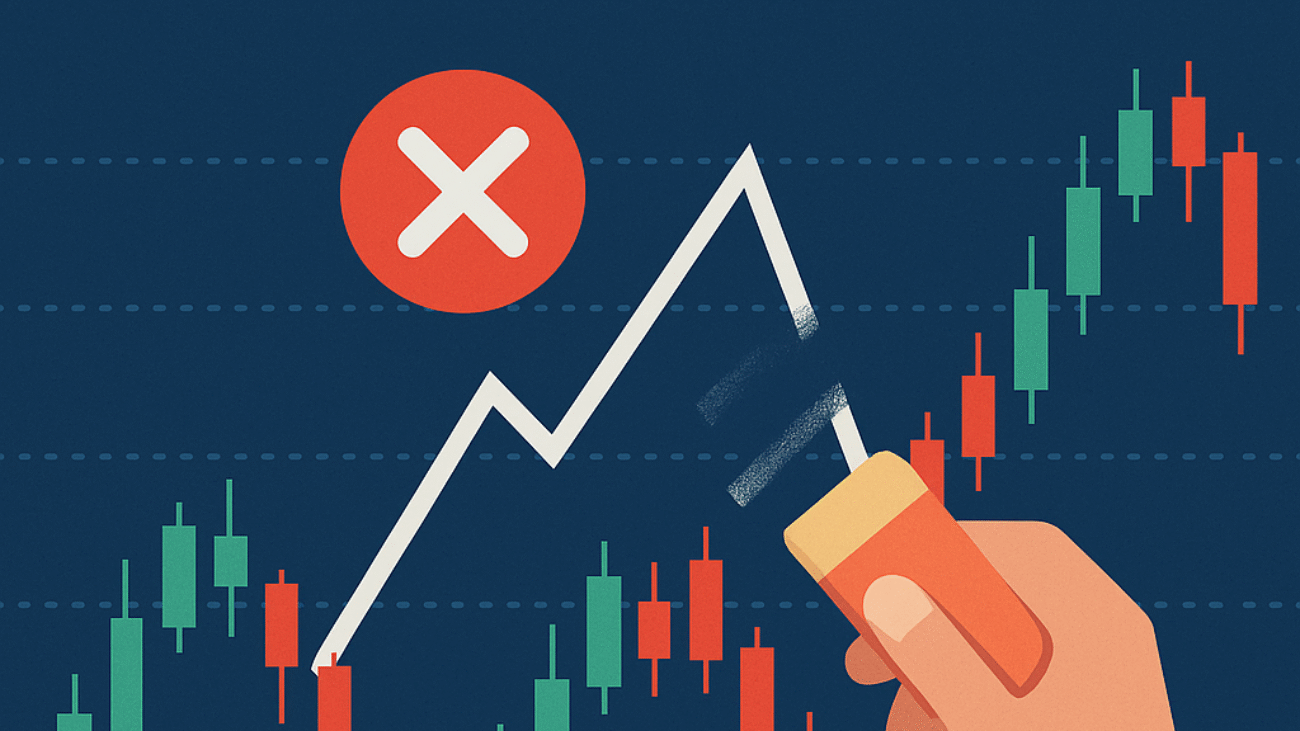
Imagine staring at your trading screen, trying to make sense of the endless charts and indicators. You believe you’ve got a solid strategy, yet your trades consistently underperform. After reading this article, you’ll be able to spot and avoid common technical analysis mistakes that hinder your success.
Whether you’re just starting to invest or looking to refine your strategy, it’s essential to recognize pitfalls in technical analysis (the study of past price movements to forecast future trends). Let’s explore the common errors and equip you with actionable insights to improve your trading outcomes.
Ignoring Market Trends Can Be Costly
One of the most frequent mistakes is overlooking market trends. Traders often jump in and out of trades based on short-term fluctuations, ignoring the overall direction. Recognizing whether the market is bullish (upward trend) or bearish (downward trend) is crucial for making informed choices.
DIY tip: Spend a week using moving averages to track market trends. This simple tool can help you identify the general direction before entering trades.
Over-Reliance on Indicators
Indicators can provide valuable insights, but depending solely on them can lead to misguided decisions. Many traders fail to consider market context and end up making trades based on lagging signals. It’s vital to use indicators as guidelines rather than definitive answers.
DIY tip: Combine two to three indicators for a more robust analysis. For instance, pairing RSI (Relative Strength Index) with MACD (Moving Average Convergence Divergence) can enhance your decision-making process.
Neglecting Risk Management Strategies
Traders often become overly enthusiastic when they spot a favorable setup, neglecting risk management. Without proper measures in place, a small loss can escalate into a serious setback. A disciplined approach to risk can protect your capital in volatile markets.
DIY tip: Define your risk tolerance and set stop-loss orders before entering any trade this week. This will help you safeguard against unexpected market movements.
Emotional Trading: The Silent Killer
Emotional trading is a critical mistake many investors make, influencing decisions based on fear, greed, or impatience. Often, this leads to buying high and selling low—an approach that undermines profits. Maintaining emotional discipline is key to following your trading plan.
DIY tip: Create a trading journal where you document your emotional state during trades. Reflect on these entries weekly to help improve emotional control.
A Practical Example
Consider an unnamed investor who relied solely on indicators without assessing market trends. She consistently entered trades at the wrong time, resulting in losses. By adjusting her strategy to incorporate trend analysis, she turned her trading performance around, making more informed decisions and achieving profitable outcomes.
Case Study
Let’s look at Amit, 28, from Bangalore. As a software engineer, he has an investible surplus of ₹30,000/month. Initially, he ignored market trends, which led him to lose ₹25,000 over three months. After recognizing his approach was flawed, Amit began tracking trends and incorporating risk management techniques. Within six months, his returns improved dramatically to around ₹50,000, showcasing how effective adjustments can lead to better financial outcomes. (Note: this is an illustrative scenario, not a prediction.)
Frequently Asked Questions
What is technical analysis in trading?
Technical analysis involves evaluating price movements and trading volumes to forecast future price changes. It primarily uses charts and indicators to guide trading decisions.
How can I improve my trading with technical analysis?
To enhance your trading, focus on understanding market trends, utilizing appropriate indicators, and practicing disciplined risk management strategies. These steps can lead to informed decisions.
Why is emotional control important in trading?
Emotional control helps traders stick to their plans and avoid impulsive decisions. By managing emotions, investors can reduce the risk of losses caused by fear or greed.
What are some common indicators used in technical analysis?
Common indicators include Moving Averages, RSI (Relative Strength Index), MACD (Moving Average Convergence Divergence), and Bollinger Bands, among others. Each serves different analytical purposes.
Conclusion
Technical analysis can enhance your trading, but common mistakes may hold you back. By recognizing these pitfalls and applying corrective actions, you’ll improve your trading strategy.
Ready to see how this works for you? Test your strategy with the WealthAlpha Portfolio Evaluator.
Disclaimer: This article is for educational purposes only and does not constitute investment advice. Mutual fund and securities investments are subject to market risks. Past performance does not indicate future results. Please read all scheme-related documents carefully and consult a SEBI-registered investment adviser before investing.