

Have you ever stared at a stock chart and wished you understood what all those lines meant? If you’ve been curious about technical indicators, understanding Bollinger Bands can help you make more informed trading decisions. By the end of this article, you’ll know how to apply this tool effectively to enhance your investing strategy.
Bollinger Bands are designed to indicate volatility in the market and help you identify potential buy and sell signals. This guide will break down the concept into easily digestible parts so that you can start using them in your trading this week.
Why Understanding Bollinger Bands is Essential
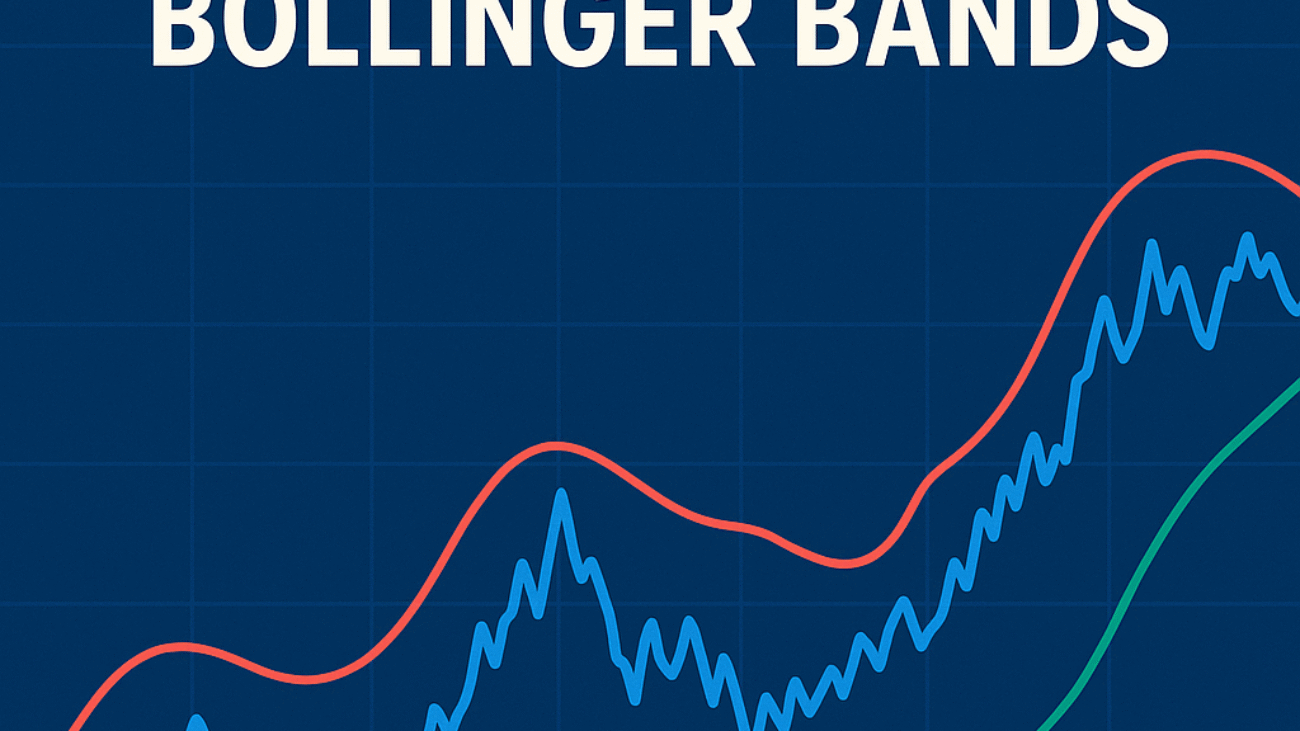
Bollinger Bands consist of three lines: a simple moving average (SMA) in the middle, and two outer bands that adjust based on market volatility. When the price moves towards the upper band, it shows an overbought condition, while movements towards the lower band indicate oversold conditions. This dual dynamic of the bands helps you gauge whether a stock is potentially overpriced or underpriced.
DIY tip: Plot Bollinger Bands on a chart of your favourite stock this week, and observe how the prices interact with the bands.
How to Interpret Bollinger Bands
To make the most of Bollinger Bands, focus on how the stock price behaves in relation to these bands. If the price consistently touches the upper band, it may be time to consider selling. Conversely, if it approaches the lower band, a buying opportunity might arise. The distance between the bands is key; wider bands indicate higher volatility, while narrower bands signal lower volatility.
DIY tip: Watch a stock for a week, noting when it touches the upper and lower bands, then reflect on the moves that followed.
Incorporating Bollinger Bands into Your Trading Strategy
Many traders use Bollinger Bands alongside other indicators like RSI (Relative Strength Index) or MACD (Moving Average Convergence Divergence) for a more comprehensive view. For example, a buy signal might occur when the price hits the lower band and RSI shows it is in the oversold region. This combination can confirm your trading decisions and reduce risks.
DIY tip: Experiment with combining Bollinger Bands and RSI on paper trades this week to see how they complement each other.
Mitigating Risks with Bollinger Bands
While Bollinger Bands can help identify potential trading opportunities, it’s important to combine their signals with other strategies. Rigorous stop-loss orders and risk assessment should accompany any buy or sell actions to safeguard your investments. Be mindful that false signals can occur, and avoid making rash decisions based solely on this indicator.
DIY tip: Set up a risk management plan that includes stop-loss orders and back-test it using past data to see how well Bollinger Bands identify true market trends.
A Practical Example
Meet a trader, Ravi, who has been watching a tech stock. One day, the stock price dipped to the lower Bollinger Band. Ravi decided to buy shares. Over the next few weeks, the stock price returned to the middle band before rising towards the upper band. This timing helped Ravi lock in a healthy return.
Case Study: Priya’s Journey with Bollinger Bands
Consider Priya, a 30-year-old IT professional from Bengaluru. She had a monthly investible surplus of ₹40,000. Initially, Priya used traditional buy-and-hold strategies with her investments. After learning about Bollinger Bands, she started adjusting her trading approach. By employing Bollinger Bands for her stock selections, she spotted a tech stock bouncing off the lower band. She invested ₹10,000. Within a few weeks, the stock price reached the middle band, allowing her to sell and realize a profit of ₹3,000. (This example is illustrative, not a forecast.)
Frequently Asked Questions
What are Bollinger Bands?
Bollinger Bands are a set of three lines that indicate market volatility and price levels. They help traders identify buy and sell opportunities. The bands consist of a moving average line and upper and lower bands based on standard deviation.
How do I set up Bollinger Bands?
To use Bollinger Bands, you typically set the middle band as a 20-day simple moving average. The outer bands are set two standard deviations above and below the middle line, adjusting automatically as market conditions change.
Can Bollinger Bands predict stock movements?
Bollinger Bands can’t predict stock movements with certainty, but they can signal potential overbought or oversold conditions. They should be used in conjunction with other indicators for better decision-making.
Are Bollinger Bands suitable for beginners?
Yes, Bollinger Bands are relatively easy to understand and can be a great starting point for beginners. They visually represent price volatility and can help new investors spot potential trading opportunities.
Conclusion
Understanding Bollinger Bands can be a valuable addition to your investing toolkit. Their ability to indicate market volatility helps in making informed decisions. Ready to see how this works for you? Test your strategy with the WealthAlpha Portfolio Evaluator.
Disclaimer: This article is for educational purposes only and does not constitute investment advice. Mutual fund and securities investments are subject to market risks. Past performance does not indicate future results. Please read all scheme-related documents carefully and consult a SEBI-registered investment adviser before investing.