

Have you ever stared at a stock chart, wondering when to buy or sell? If you feel overwhelmed by the market’s ups and downs, don’t worry; you’re not alone. Understanding trend lines can make your investing journey smoother and more informed.
In this article, you’ll learn the basics of trend lines, how they can help you make better investment decisions, and practical steps to incorporate them into your strategy. Get ready to enhance your skills and gain confidence!
Understanding Trend Lines: Your Path to Smarter Investing
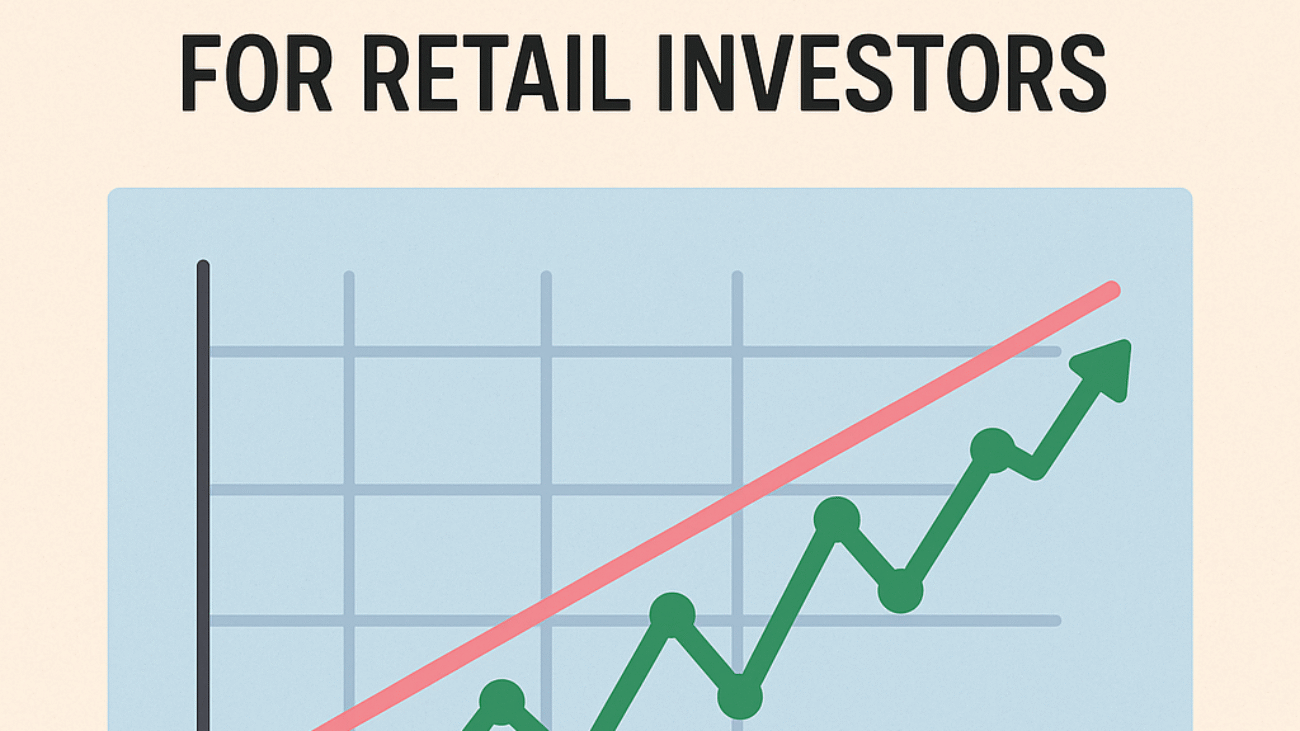
Trend lines are straight lines drawn on a chart that help identify the general direction of a stock’s price movement. An upward trend line indicates that prices are generally rising, while a downward line suggests a decline. They can be powerful tools for spotting potential entry and exit points.
DIY tip: This week, identify a stock you are interested in and draw the trend lines on its chart. Notice the price movements relative to your drawn lines.
Types of Trend Lines You Need to Know
There are three basic types of trend lines: ascending, descending, and horizontal. Ascending lines demonstrate increasing prices over time, while descending lines show a decrease. Horizontal lines indicate stable prices, which may signal consolidation or indecision among investors.
DIY tip: Review a few stock charts and practice identifying different types of trend lines. This will help you recognize patterns in future investments.
How to Use Trend Lines in Your Trading Strategy
Using trend lines effectively requires patience and practice. They can help you set price targets and determine stop-loss levels, giving you a structured approach to trading. When prices break through a trend line, it may signal a reversal or continuation of the trend.
DIY tip: When you identify a trend line, set alerts for when prices approach it. This helps you stay disciplined and informed without constantly monitoring the charts.
Limitations of Trend Lines: What Investors Should Know
While trend lines can be useful, they are not foolproof. They rely on historical data and are subjective; different analysts may draw them differently. Additionally, markets can be volatile, and prices may not always respect the trend lines.
DIY tip: Incorporate other technical indicators, like moving averages, with trend lines to confirm your analysis before making investment decisions.
A Practical Example
Consider an unnamed investor who has been using trend lines to analyze Stock XYZ. By drawing a clear upward trend line, they identify a potential buying opportunity. After entering the market, the investor sees significant gains as the price continues to rise, allowing for a successful exit later.
Case Study
Meet Ravi, 28, from Mumbai, a sales executive with a monthly investible surplus of ₹30,000. Initially, he followed a random buying strategy. After learning about trend lines, he started analyzing stocks. By drawing trend lines, he noticed that Stock ABC had consistent upward movements. Ravi invested ₹15,000 and, within six months, his investment appreciated to ₹25,000. This change helped him realize the benefits of analyzing price movements.
(Note: This case is illustrative and not a forecast.)
Frequently Asked Questions
What are trend lines used for?
Trend lines are used to identify the general direction of a stock’s price movement, helping investors make informed decisions about when to buy or sell.
Can trend lines guarantee success in trading?
No, trend lines are tools to assist in decision-making but do not guarantee success. They should be used in combination with other technical indicators for better accuracy.
How often should I update my trend lines?
Regularly update your trend lines, especially after significant price movements or market events, to ensure they remain accurate and relevant.
Are trend lines suitable for all types of investors?
Yes, trend lines can be beneficial for all investors, from beginners to professionals, as they provide a clear visual representation of price movements.
Conclusion
Understanding the basics of trend lines can significantly enhance your investing strategy and improve decision-making. Start analyzing charts today! Ready to see how this works for you? Test your strategy with the WealthAlpha Portfolio Evaluator.
Disclaimer: This article is for educational purposes only and does not constitute investment advice. Mutual fund and securities investments are subject to market risks. Past performance does not indicate future results. Please read all scheme-related documents carefully and consult a SEBI-registered investment adviser before investing.