

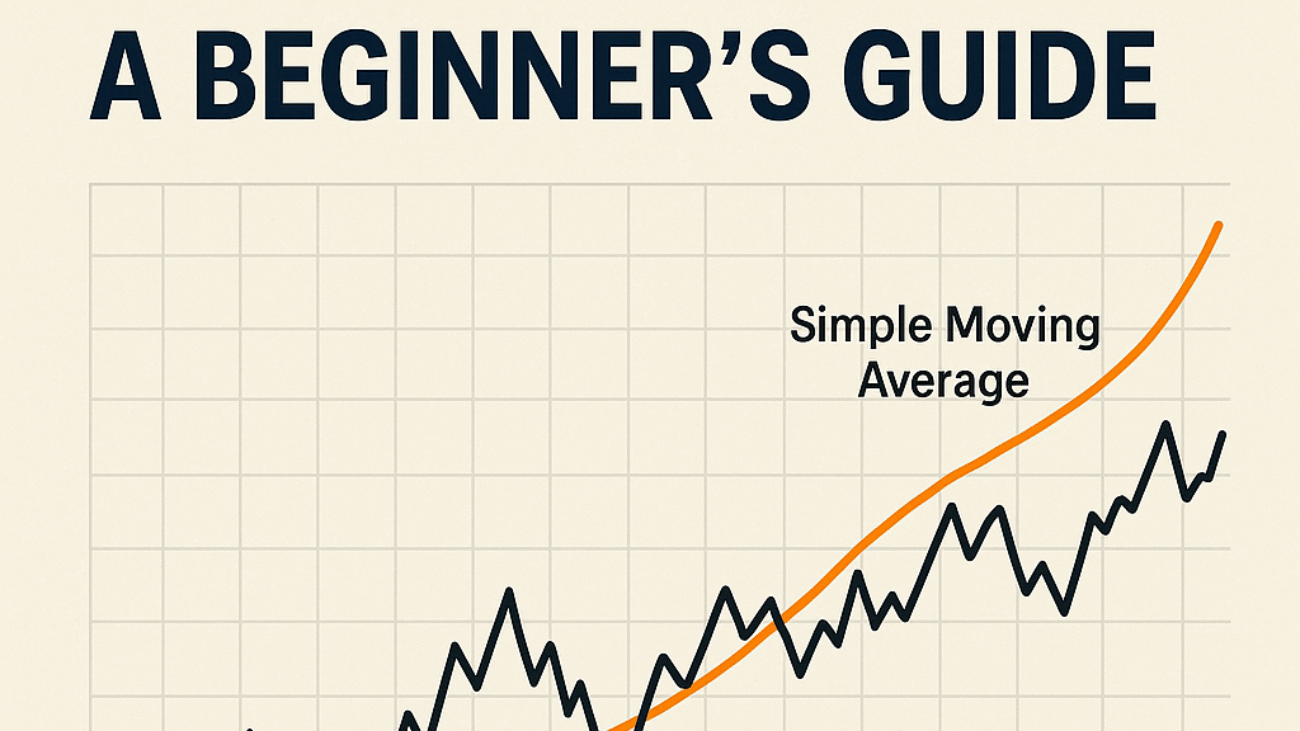
Imagine sitting down to analyze stock prices, feeling overwhelmed by the noise of daily fluctuations. How do you discern the underlying trends? With Simple Moving Averages (SMAs), you can smooth out price data and identify trends easily. After reading this guide, you’ll understand how to use SMAs to make informed investment decisions.
Whether you’re new to investing or looking to refine your strategy, grasping the concept of SMAs can enhance your trading skills. This beginner’s guide will walk you through everything you need to know.
What Are Simple Moving Averages and Why Use Them?
Simple Moving Averages (SMAs) calculate the average price of a stock over a specific period, usually days, weeks, or months. By smoothing out the price data, SMAs help investors identify trends without the noise of daily price changes. For beginners, incorporating SMAs into your strategy can clarify whether a stock is in an upward or downward trend.
DIY tip: This week, track a stock you’re interested in. Calculate its SMA for the last 10 days using closing prices to see how the trend develops.
Choosing the Right Time Period for Simple Moving Averages
The time period you choose for calculating an SMA significantly influences its effectiveness. Shorter SMAs (like 10 or 20 days) react quickly to price changes, making them useful for short-term trading. However, longer SMAs (like 50 or 200 days) offer a broader view of the market trend, helping long-term investors avoid sudden market fluctuations.
DIY tip: Set up two different time periods for SMAs—one short (like a 10-day SMA) and one long (like a 50-day SMA) on a stock. Observe how they interact over a week.
How Simple Moving Averages Guide Your Trading Decisions
SMAs can be crucial in determining entry and exit points in the stock market. For instance, when a short-term SMA crosses above a long-term SMA, it indicates a buying opportunity (often called a “golden cross”). Conversely, when it crosses below, it suggests a selling point (referred to as a “death cross”). These signals can optimize your investing strategy.
DIY tip: Use a stock charting tool to set alerts for when SMAs cross. This can help you make timely trading decisions.
When to Avoid Relying Solely on Simple Moving Averages
While SMAs can streamline your decision-making, relying on them alone can be risky. They lag behind actual price action, missing sudden market shifts. Additionally, they don’t consider external factors like news or economic data, which can influence prices unexpectedly. It’s essential to combine SMA analysis with other indicators to create a well-rounded strategy.
DIY tip: This week, pair your SMA analysis with other tools like Relative Strength Index (RSI) or moving average convergence divergence (MACD) to gauge market sentiment.
A Practical Example
Consider an unnamed investor who decided to apply SMAs to their trading strategy. By observing the 10-day and 50-day SMAs of a chosen stock, they noticed a golden cross forming. Acting on this signal, they purchased shares, leading to a 15% gain over the next few weeks as the stock continued its upward trend.
Case Study
Meet Priya, 30, from Pune, an IT professional with a monthly investible surplus of ₹40,000. Initially, she overlooked technical indicators like SMAs, focusing only on fundamental analysis. After learning about SMAs, she incorporated a 20-day SMA into her strategy. Over six months, she made timely purchases and sales based on SMA signals, increasing her investment returns by approximately 20%. This example demonstrates how adapting your approach can yield positive results, though these figures are illustrative and not a guarantee.
Frequently Asked Questions
What is the basic formula for calculating a Simple Moving Average?
The basic formula for a Simple Moving Average is: Sum of closing prices over a specified period divided by the number of time periods. This gives you the average price for that timeframe.
How often should I recalculate SMAs?
Recalculate your SMAs regularly according to your selected period. For example, if you’re using a 10-day SMA, update it daily with the new closing prices to reflect current trends.
Can Simple Moving Averages indicate market reversals?
Yes, SMAs can indicate potential market reversals, particularly during crossovers. A crossover between short-term and long-term SMAs may signal a change in trend direction.
Are Simple Moving Averages suitable for all market conditions?
No, while SMAs are helpful, they work best in trending markets. In choppy or volatile market conditions, they may generate misleading signals.
Conclusion
In summary, Simple Moving Averages provide a valuable tool for investors to identify trends and make informed decisions. By incorporating different time periods and combining them with other indicators, you can enhance your trading strategy.
Ready to see how this works for you? Test your strategy with the WealthAlpha Portfolio Evaluator.
Disclaimer: This article is for educational purposes only and does not constitute investment advice. Mutual fund and securities investments are subject to market risks. Past performance does not indicate future results. Please read all scheme-related documents carefully and consult a SEBI-registered investment adviser before investing.